

Occupancy & peak hour trends
Know when it's busiest, plan around it. Occupancy and peak hour trends identifies the busiest hours and zones automatically from live camera counts, so staffing and planning decisions aren't guesswork.
- Live occupancy counts per camera, zone, or site
- Historical peak-hour and peak-day trends over time
- Zone-by-zone comparison across a single site
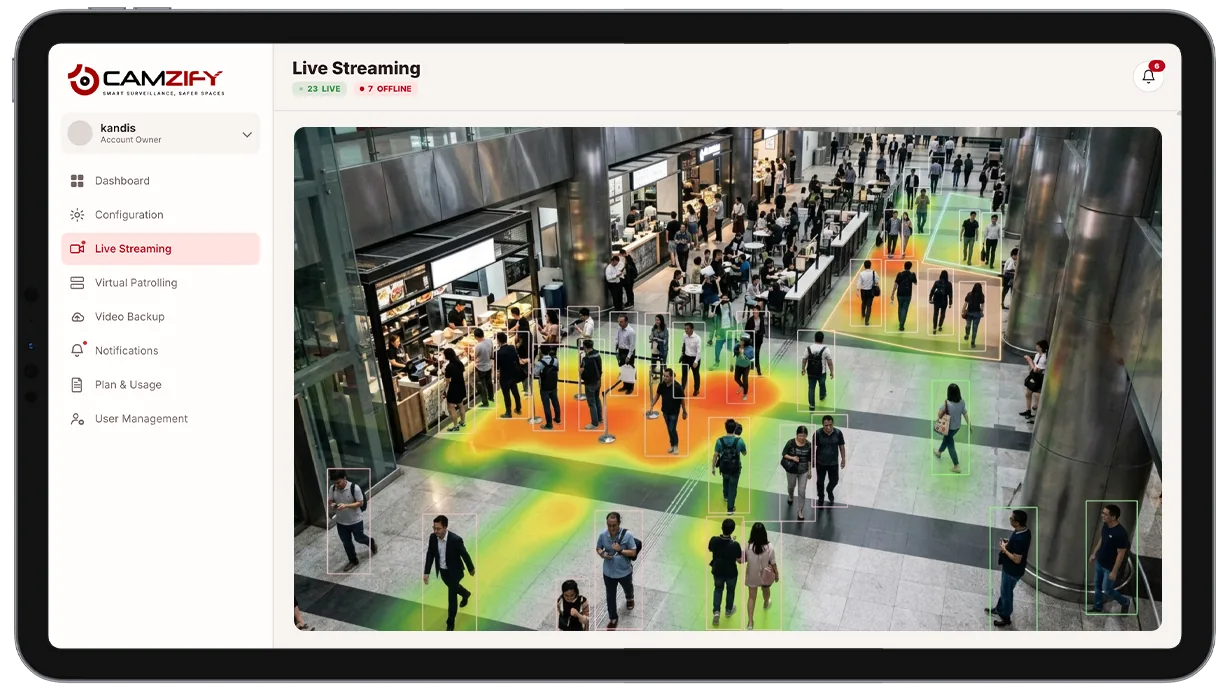
This capability tracks:
- • Live occupancy counts per camera, zone, or site
- • Historical peak-hour and peak-day trends over time
- • Zone-by-zone comparison across a single site
- • Trend data exportable for staffing and space-planning decisions
- • Portfolio-level comparison across a multi-site account
Why occupancy and peak hour trends matter
Staffing, cleaning schedules, and restocking windows are usually set based on rough assumptions, "lunch is busy," "weekends are slower", rather than actual measured data. Those assumptions drift over time as customer behavior changes, and nobody notices until a location is visibly understaffed during a rush or overstaffed during a lull.
Dedicated people-counting sensors can answer this, but they mean new hardware, new installation, and another system to maintain, often not worth it just to answer a scheduling question.
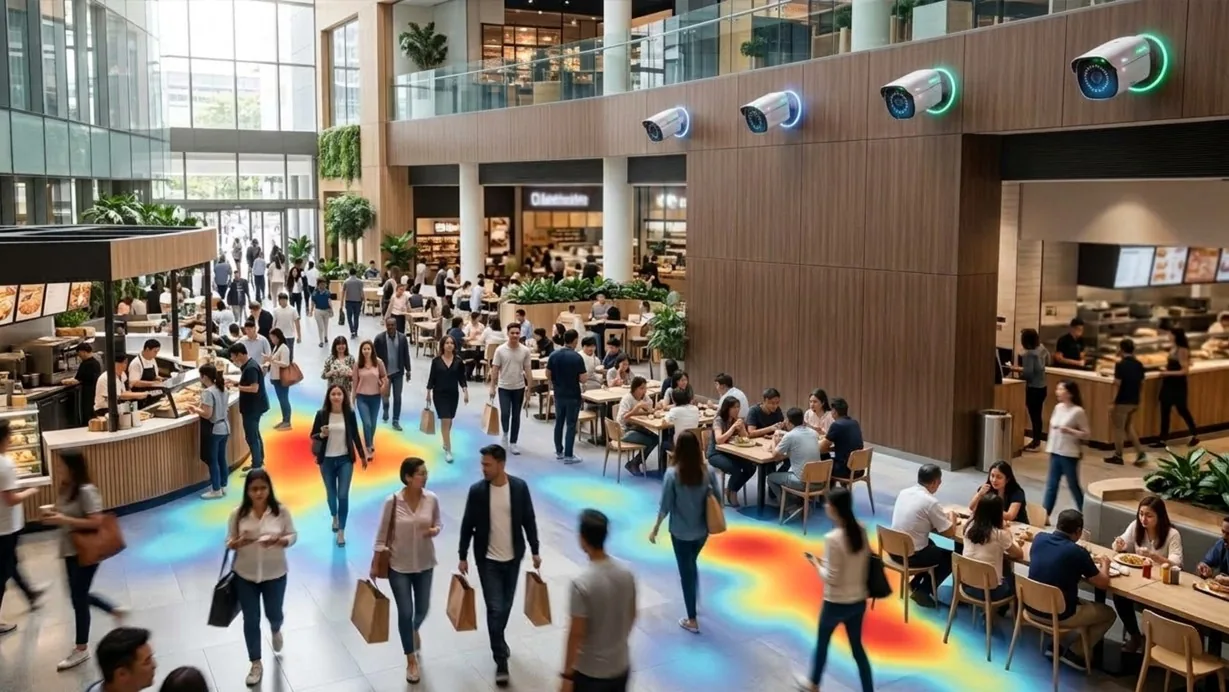
Occupancy and peak hour trends answers it using cameras that are already in place, turning live subject counts into a continuous, accurate picture of when and where a site is actually busiest.
How it works
Aggregating live counts
Confirmed subject counts from multi-object tracking are aggregated continuously per camera or defined zone, building a live occupancy figure that updates in real time.
Building the trend line
Live counts accumulate into a historical trend broken down by hour of day and day of week, surfacing peak windows automatically rather than requiring a manual count or a separate people-counting sensor.
Where the data feeds
Occupancy data feeds the platform's analytics and reporting module alongside heatmap anomalies for a fuller picture of site activity.
Configuration
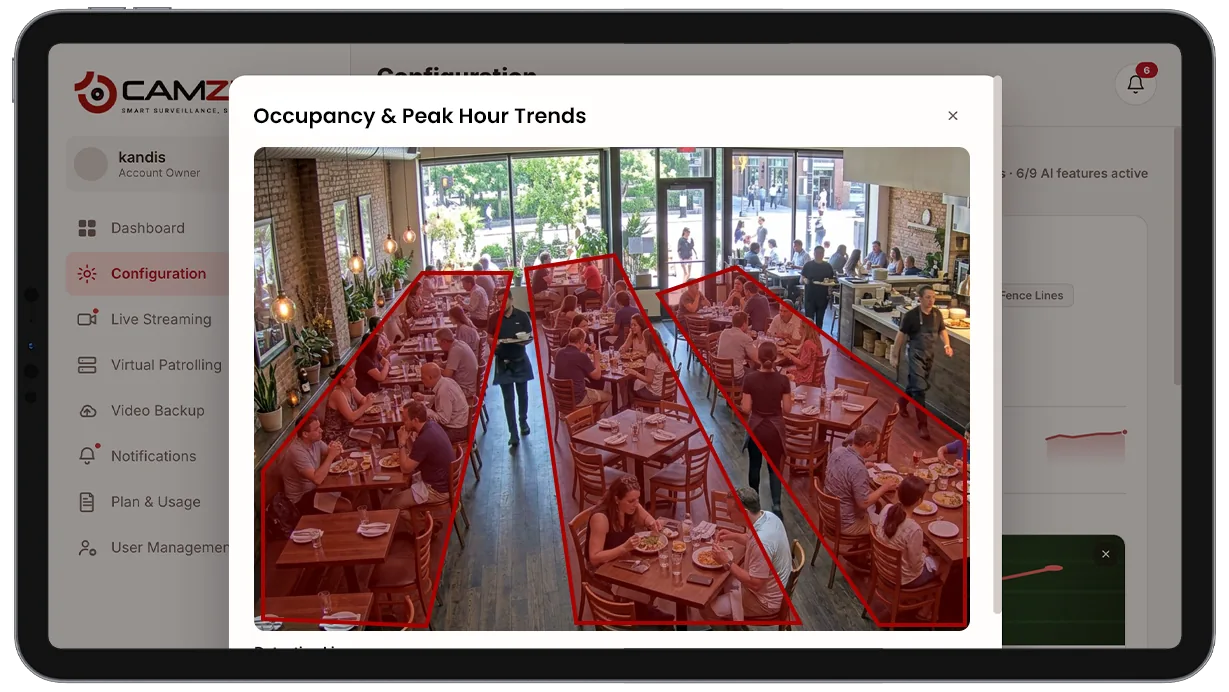
Zones are marked on the camera view or site map for per-area occupancy tracking. Each account supports:
- • Zone boundaries for per-area occupancy tracking
- • Reporting windows and comparison periods
- • Notification window per camera: notifications only in the hours you set
- • Per-camera instance licensing
Common scenarios
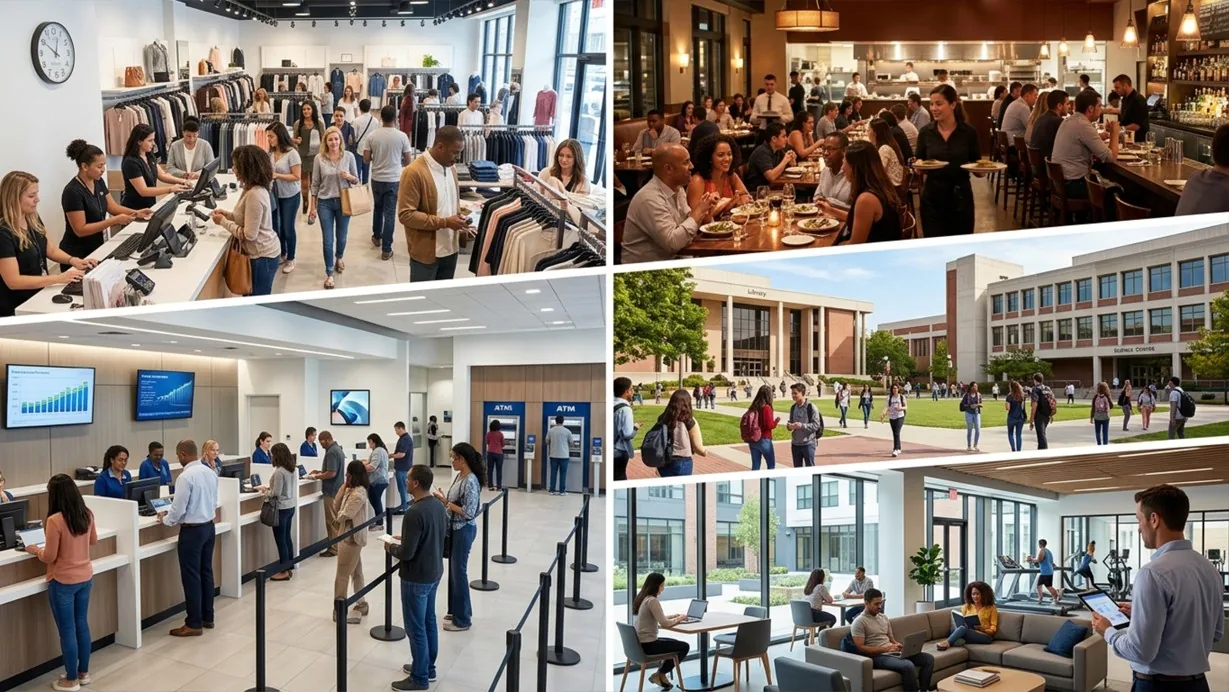
- • A retail store scheduling staff around measured lunch and weekend peaks
- • A restaurant identifying its true busiest hours ahead of adding evening shifts
- • A bank branch planning teller coverage around actual foot traffic patterns
- • A campus facility comparing occupancy across buildings for space planning
- • A property manager tracking common-area usage trends across a portfolio
In a patrol round
Occupancy tracking runs as continuous background analytics rather than a per-camera checklist item during a virtual patrol round, but occupancy trends for a patrolled site are visible alongside that site's patrol reports.
Industries using this
Related detections
Frequently asked questions
Ready to patrol your site 24/7?
Book a 15-minute demo and see a live patrol run on your own cameras.